Three new reports rank cities with an eye on energy efficiency. How do the rankings compare, and what do they mean overall?
When it comes to energy efficiency initiatives, how does your city stack up? It depends on where you look. Three new reports now rank U.S. cities with a focus on their energy efficiency initiatives, but how do the rankings compare to one another? It is not exactly an apples-to-apples comparison.
This week, CBRE Group, Inc. released its fourth annual Green Building Adoption Index (GBAI) report, which assesses the adoption rates of LEED and ENERGY STAR certifications in 30 major markets across the United States. The Chicago market re-took the top spot this year, having stayed in the top two slots along with San Francisco every year of the report. The GBAI report provides local jurisdictions a helpful look into the green building landscape of their local real estate markets, including a summary of some of the major developments, renovations, and leasing in the last year, and their effects on local green building certification.
In the Chicago market, the GBAI report notes that 12 of the top 25 transactions in 2016 were in LEED-certified buildings. In addition, the overall green-certified square footage increased by 6.5 percent since 2015, which is an exciting development that may be due to the City of Chicago’s energy benchmarking and transparency law, which has been in place since 2013.

Image: Pexels.com
The Institute for Market Transformation (IMT) provided subject-matter expertise to CBRE and Maastricht University on the energy efficiency policy landscape of the markets featured in the 2017 report, which supported their analysis of whether local benchmarking and transparency policies lead to greater adoption of green building certifications (LEED and ENERGY STAR). The results of a simple regression model indicate that there are higher adoption rates of green building certifications in cities where they have passed or implemented a benchmarking and transparency policy. Though this model does not imply causation, it does indicate that additional research is necessary to look at the effects of benchmarking policies on local markets.
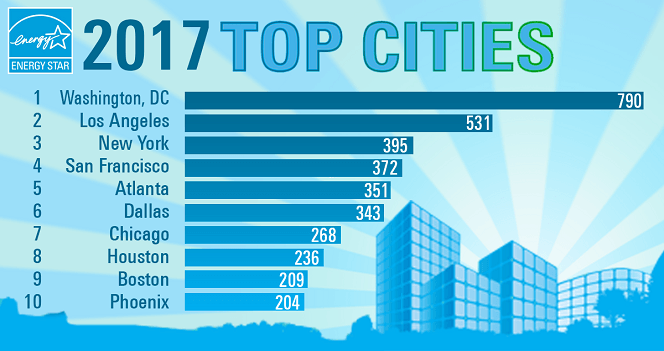
The GBAI report is complemented by the release of ENERGY STAR’s 2017 rankings of cities (also presented as metropolitan areas), which ranks localities by the number of ENERGY STAR-certified buildings within their area. Though the results are not presented on a per-capita or percentage basis, they do show the magnitude of ENERGY STAR adoption within a city, with separate lists for overall leaders, mid-size cities, and small cities. Washington, D.C. topped this year’s overall rankings with 790 buildings certified for 2016, representing 174 million square feet.
While Chicago led the GBAI this year, it placed seventh in this report. The District’s top finish was likely driven by strong demand from local tenants for energy-efficient space. The largest tenant in the District is the federal government, which will generally only lease space in buildings that are ENERGY STAR-certified. The ENERGY STAR rankings also provide estimated cost savings and avoided carbon emissions for each metro area, which is a unique feature to this ranking. With its 790 buildings, the District is avoiding 716,000 metric tons of carbon-equivalent and $167 million in energy costs locally.
The American Council for an Energy-Efficient Economy (ACEEE) also released a city ranking methodology with the release of its 2017 City Energy Efficiency Scorecards, which awards points to cities for actions in five key areas, including buildings and transportation policies. Unlike the GBAI and ENERGY STAR rankings, ACEEE’s Scorecard looks less at the direct adoption of energy-efficient practices in the real estate market, and more on the summary of actions that a city may have taken or been subject to in order to boost efficiency. In this respect, Boston took the top ranking this year, because of strong utility programs in Massachusetts and energy efficiency policies for municipal and private buildings, while Chicago placed seventh.
There are many ways to analyze and compare the uptake of energy efficiency in different markets and the role of cities in advancing this trend. What these recent efforts have in common is that they all highlight the progress that the private sector is making to increase efficiency in commercial buildings, or in the ACEEE City Scorecards’ case, actions that cities are taking to work with the private sector.
Want to learn more? Click here to learn about IMT’s work with governments on progressive building energy policy and programs.

