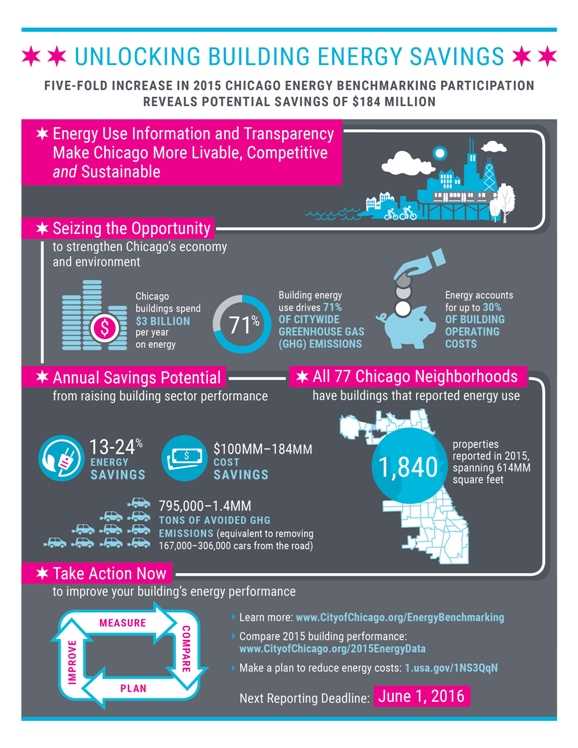
On December 16th, the City of Chicago released its 2015 Chicago Energy Benchmarking Report and Infographic, summarizing results from 2015 implementation of the Chicago Energy Benchmarking Ordinance.
Chicago’s energy benchmarking ordinance raises awareness of building energy performance through information and transparency, with the goal of unlocking energy and cost savings opportunities for businesses and residents. Large properties 50,000 square feet and greater are required to track whole-building energy use, report to the City annually, and verify data once every three years.
The law covers less than 1 percent of Chicago’s buildings, which account for approximately 20 percent of citywide building energy use. Through the City Energy Project, IMT and the Natural Resources Defense Council (NRDC) have been partnering with the City of Chicago to develop and implement its benchmarking ordinance.
2015 Chicago Energy Benchmarking Infographic
Here’s why the December release is important both within Chicago and beyond:
First, there’s a lot more data. Adding to the first year of implementation in 2014, Chicago saw a five-fold increase in the number of participating buildings due to a second-year ordinance phase-in during 2015. A total of 1,840 properties spanning 614 million square feet reported information in 2015, and every neighborhood in Chicago now has at least one reporting property.
Second, building stakeholders can now access property-specific results; in 2015, the City was authorized to publish building-specific data for properties that were required to comply in both 2014 and 2015, which is approximately 250 buildings. This data is now online at the City’s Data Portal.
Screen Shot: City of Chicago Data Portal – Energy Benchmarking Data
In conjunction with this release, Chicago partnered with the City Energy Project to develop an Energy Performance Map / Data Visualization to allow the public to easily find buildings and compare performance amongst similar buildings.
Screen Shot: Chicago Energy Performance Mapping Tool
Why is this important?
The new level of visibility offered by the data release and the associated visualization platform allows owners and managers to compare their properties’ performance with other, similar properties in the market, and allows them to start identifying high-impact opportunities for improvements.
In addition, other groups can now review the energy consumption and performance of specific properties. For example, a tenant or resident can determine the energy performance of the building where they lease space, and may begin discussions with the property owner or manager if the performance doesn’t match up to what was expected.
That’s not all. Brokers, leasing agents, and attorneys may consider the energy performance of the property when working with clients to develop or renegotiate a lease, and may consider incorporating green leasing language into future leases. And energy engineers and architects who have designed buildings in recent years can determine if the properties are performing as planned, and can better understand what design aspects may or may not be driving energy performance. Building operating engineers and their teams will also continue to play a critical role in using the data to update operations to be more efficient, and to develop and implement energy retrofits.
Already, these market-transforming activities are beginning. At the report release event on December 16th, the Archdiocese of Chicago shared information about its recent commitment to benchmark all 2,700 of its properties in the Chicagoland region, and how benchmarking data is already being used to identify cost-saving opportunities. The International Union of Operating Engineers (IUOE) Local 399 Training Director also discussed how its members are being trained in energy management techniques, and how members are using energy benchmarking results to improve operations in the properties where they work.
What’s next?
While the 2015 data release is applicable to approximately 250 properties, the City of Chicago is authorized to release additional building data in 2016 and in future years.
The City also plans to send building-specific Energy Profiles to all properties that reported in 2015, to provide property representatives with a summary of the key energy performance information that was reported, along with a comparison to the performance of similar buildings and suggestions for improving energy efficiency.
Finally, all commercial, residential, and institutional properties over 50,000 square feet are required to report benchmarking data to the City by June 1, 2016, and residential properties from 50,000 square feet to 250,000 square feet will be required to verify information, as it will be their first year to comply. For more information on upcoming compliance deadlines and free guidance and support, visit: www.CityofChicago.org/EnergyBenchmarking
