Last week, the City of Seattle released a new summary report highlighting the results of its citywide building benchmarking and transparency program for 2014 to 2016, and the findings are encouraging.
For example, consider these two highlights:
- Compliance is high. In 2016, the last year covered by the new report, 3,352 buildings reported, representing over 320 million square feet. These buildings represent over 99 percent of the properties covered by the benchmarking and reporting requirements, and that admirable compliance rate is a testament to the level of outreach and support provided by the city, as well as its ability to demonstrate the benefits of the program to building owners.
- Energy use and greenhouse gas emissions are lower. The results show that from 2014 to 2016 the total energy use for the buildings that reported for all three years—2014, 2015, and 2016—dropped by 3.7 percent, while total greenhouse gas (GHG) emissions declined by 4.8 percent. The city is clearly making very positive strides toward achieving its goals of reducing GHG emissions from buildings by 39 percent by 2030 (relative to a 2008 baseline) and 82 percent by 2050.
However, Seattle is in the midst of a tremendous building boom, leading the nation in the number of tower cranes on construction sites for each of the past three years. The city’s rapidly expanding skyline means that even more savings are needed to meet ambitious climate goals in the years ahead.
In order to move the needle more rapidly, Seattle has already undertaken some new steps that are not reflected in the current benchmarking results. For example, 2015 marked the first year that Seattle provided full transparency of benchmarking information for individual buildings, with the city posting the results for each building over 20,000 square feet on an on-line, interactive map. Making information about the performance of every large building easily accessible will allow people to take this information into account when comparing buildings and making purchasing, leasing, and investment decisions. This will provide a competitive advantage for high-performing buildings and further incentivize investments in energy efficiency. In addition, in 2016 Seattle enacted a Building Tune-Up requirement, under which commercial buildings over 50,000 square feet must identify and implement low- or no-cost actions related to building operations and maintenance. These requirements will first take effect in March 2019. Both of these recent changes will help to further accelerate adoption of energy efficiency within Seattle’s buildings.
Below: 2017 consumption by building type

Examining—and Sharing—Lessons Learned
For other cities that may still be trying to decide if a benchmarking program makes sense for them, the lessons from Seattle clearly demonstrate the value that this kind of policy can deliver. For example, benchmarking has created a strong feedback loop on citywide performance. Although the City of Seattle does not have an explicit goal for the savings that it expects to achieve through benchmarking alone, the program is providing the critical indicators staff need to track progress, as well as delivering important insights on where additional potential savings may be hiding. With the benchmarking data in hand, the city has a clear understanding of which types of local buildings are the most energy intensive, and which market sectors are the greatest contributors to total energy use and GHG emissions. This information is proving to be invaluable when staff is working with stakeholders or their local utility to explore any changes to the strategies needed to achieve the city’s goals.
During this process, Seattle has also gained valuable experience in how to best extract reliable and meaningful insights from the collected data, so it can better drive market demand for energy efficiency. For example, in order to accurately analyze and interpret the data over multiple years from the thousands of buildings that participate in its programs, the city established robust practices for cleaning the datasets and ensuring a consistent set of data. Seattle instituted a series of data quality and cleansing steps, and then used three slightly different subsets of the data, depending on which questions the city was attempting to answer:
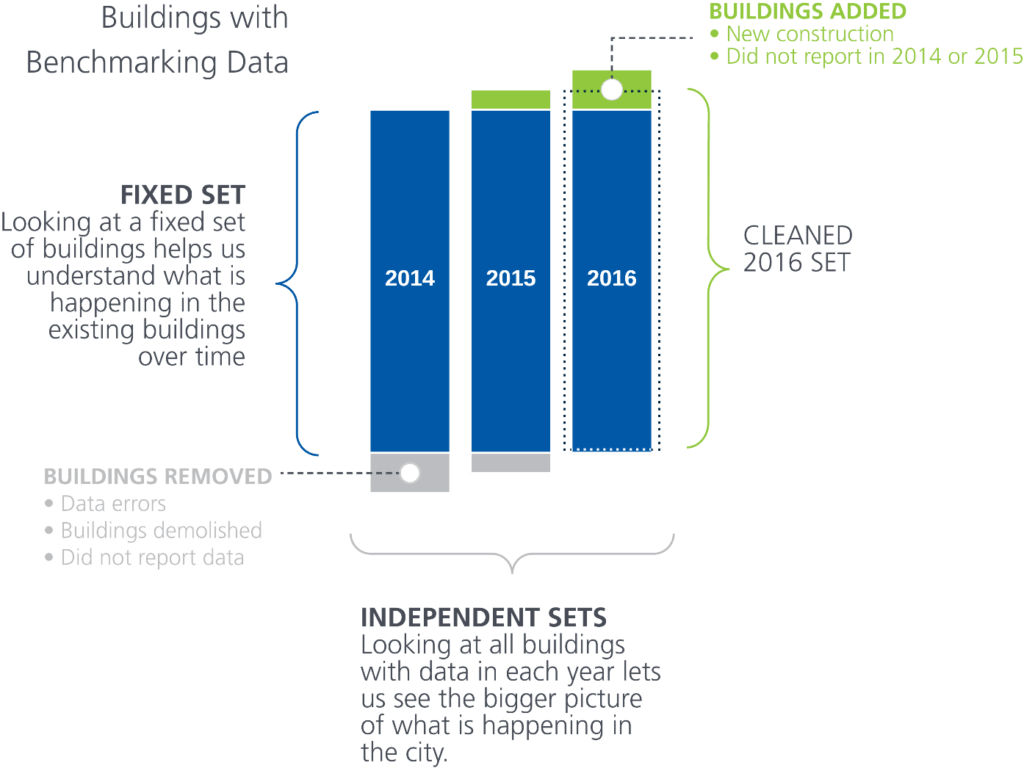
- Independent Set (for 2016): Single-year analyses were conducted using an “independent set” of buildings for a given year, which included all reported data to maximize the number of data points. This was the primary data set used for viewing non-energy characteristics such as building vintage and location.
- Cleaned Set (for 2016): To determine the energy characteristics for buildings reporting for 2016, the Independent Set was cleansed to remove outliers and records with questionable or missing data. This minimized the potential for “bad” data to skew the quantitative results.
- Fixed set (2014 through 2016): To evaluate changes in energy use over time, the Cleaned Sets for 2014 through 2016 were further filtered so that they included only those buildings that reported for each of those three years, ensuring that the analysis was looking across a stable and consistent set of buildings.
Information on these best practices is being shared with other jurisdictions in a variety of ways, so that they can avoid having to reinvent the wheel. For example, Seattle is a member of the Urban Sustainability Directors Network (USDN), a national peer-to-peer network with over 185 member communities in North America, and is actively participating in the USDN Benchmarking and Energy Data Collective Action Group. This action group, which IMT is supporting as the technical advisor, has proven to be a great venue for cities to share their experiences.
Many of these best practices are also described in the IMT report, Impact Assessment: A Guide for City Governments to Estimate the Savings from Energy Benchmarking and Energy Efficiency Programs, which looked at the work being done in Seattle, the District of Columbia, New York City, and several other leading cities to gauge the citywide impact of mandatory benchmarking and transparency programs. For those city leaders interested in learning more, an IMT webinar that covers much of this information in more detail is available for streaming now. In addition, this report is part of IMT’s Putting Data to Work toolkit, which seeks to help local governments, utilities, and program implementers learn from the leaders in the field of benchmarking, and which provides resources to help these parties gain greater value from the data they are collecting. Learn more by downloading any of the toolkit resources at imt.org/PuttingDatatoWork, and for more assistance in examining and translating the impact of building performance policies, contact IMT directly.